Weather charts, also known as surface pressure or synoptic charts, contain a lot of information that helps weather forecasters make predictions about the weather and sea conditions.
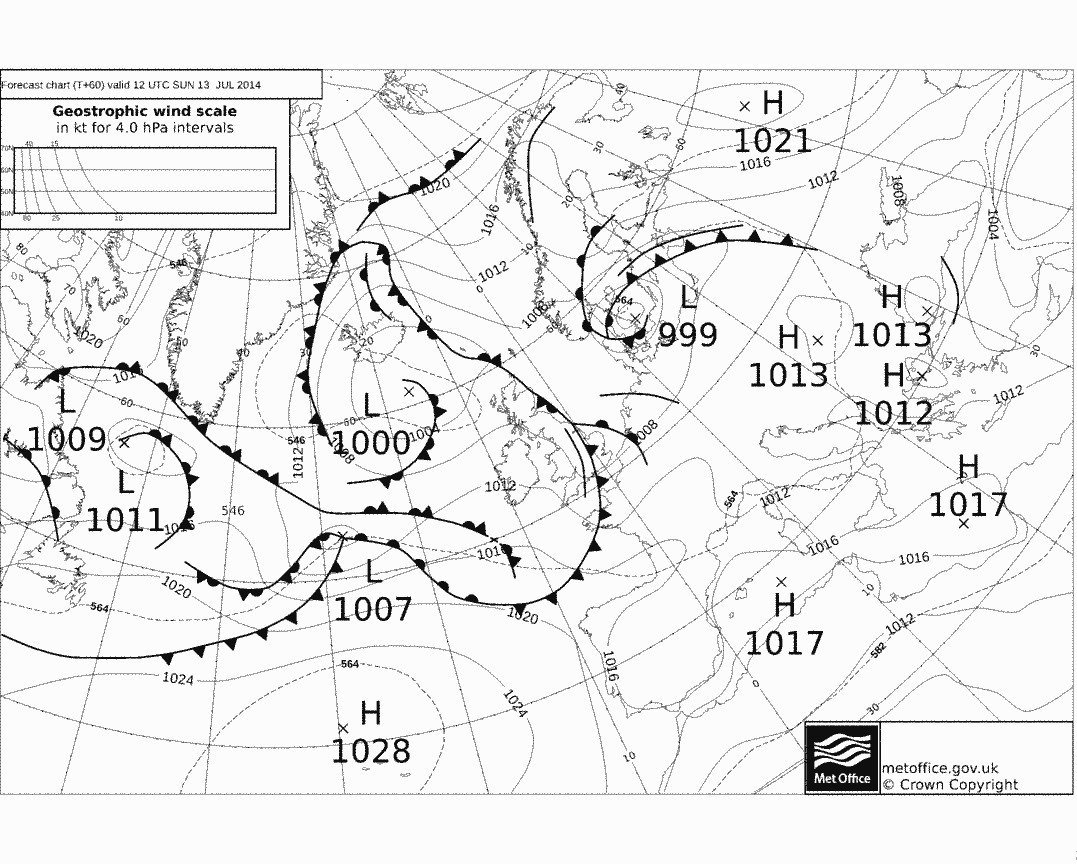
Before going to sea it is always a good idea to study weather charts and work out how the weather is likely to evolve in the area you plan to sail in. This sequence of four synoptic charts predicts the weather over a 36 hour period.

Isobars on a weather chart
The circular lines are isobars, similar to contour lines on a land map, and join areas of equal barometric pressure. Air moves from high to low pressure and when the difference in the pressure is greater, the airflow or wind will also be greater. Isobars that are close together indicate stronger winds. Isobars that are further apart indicate lighter winds. The wind scale inset in the top left of the chart helps you to forecast wind speed.

Wind direction
In terms of the wind direction, in the northern hemisphere air moves around high pressure in a clockwise direction and low pressure in an anticlockwise direction, so isobars on a weather map indicate the direction and speed of the wind as well as the pressure.

Fronts
The lines with triangles and semi-circles represent fronts. Warm fronts on a weather map are shown with semi-circles and cold fronts with triangles. The way in which the semi-circles and triangles point shows the direction in which the front is moving.
Occluded fronts and troughs
Where a cold front and warm front meet an occluded front is created, shown by lines with overlapping semi-circles and triangles. Black lines with no semi-circles or triangles are troughs and show areas where the air is unstable and showers tend to form.
It is a good idea to print out the latest weather charts for your area before you set sail and refer to them on your trip.